
SiteSkite includes a built-in Pretty Logs Viewer that allows you to monitor and inspect WordPress logs directly from the SiteSkite dashboard with a cleaner, easier-to-read interface.
Instead of opening server terminals, downloading log files, or digging through hosting panels, SiteSkite centralizes your logs into a visual debugging environment designed for developers, agencies, and site administrators.
It turns chaotic raw logs into something actually readable 🔦
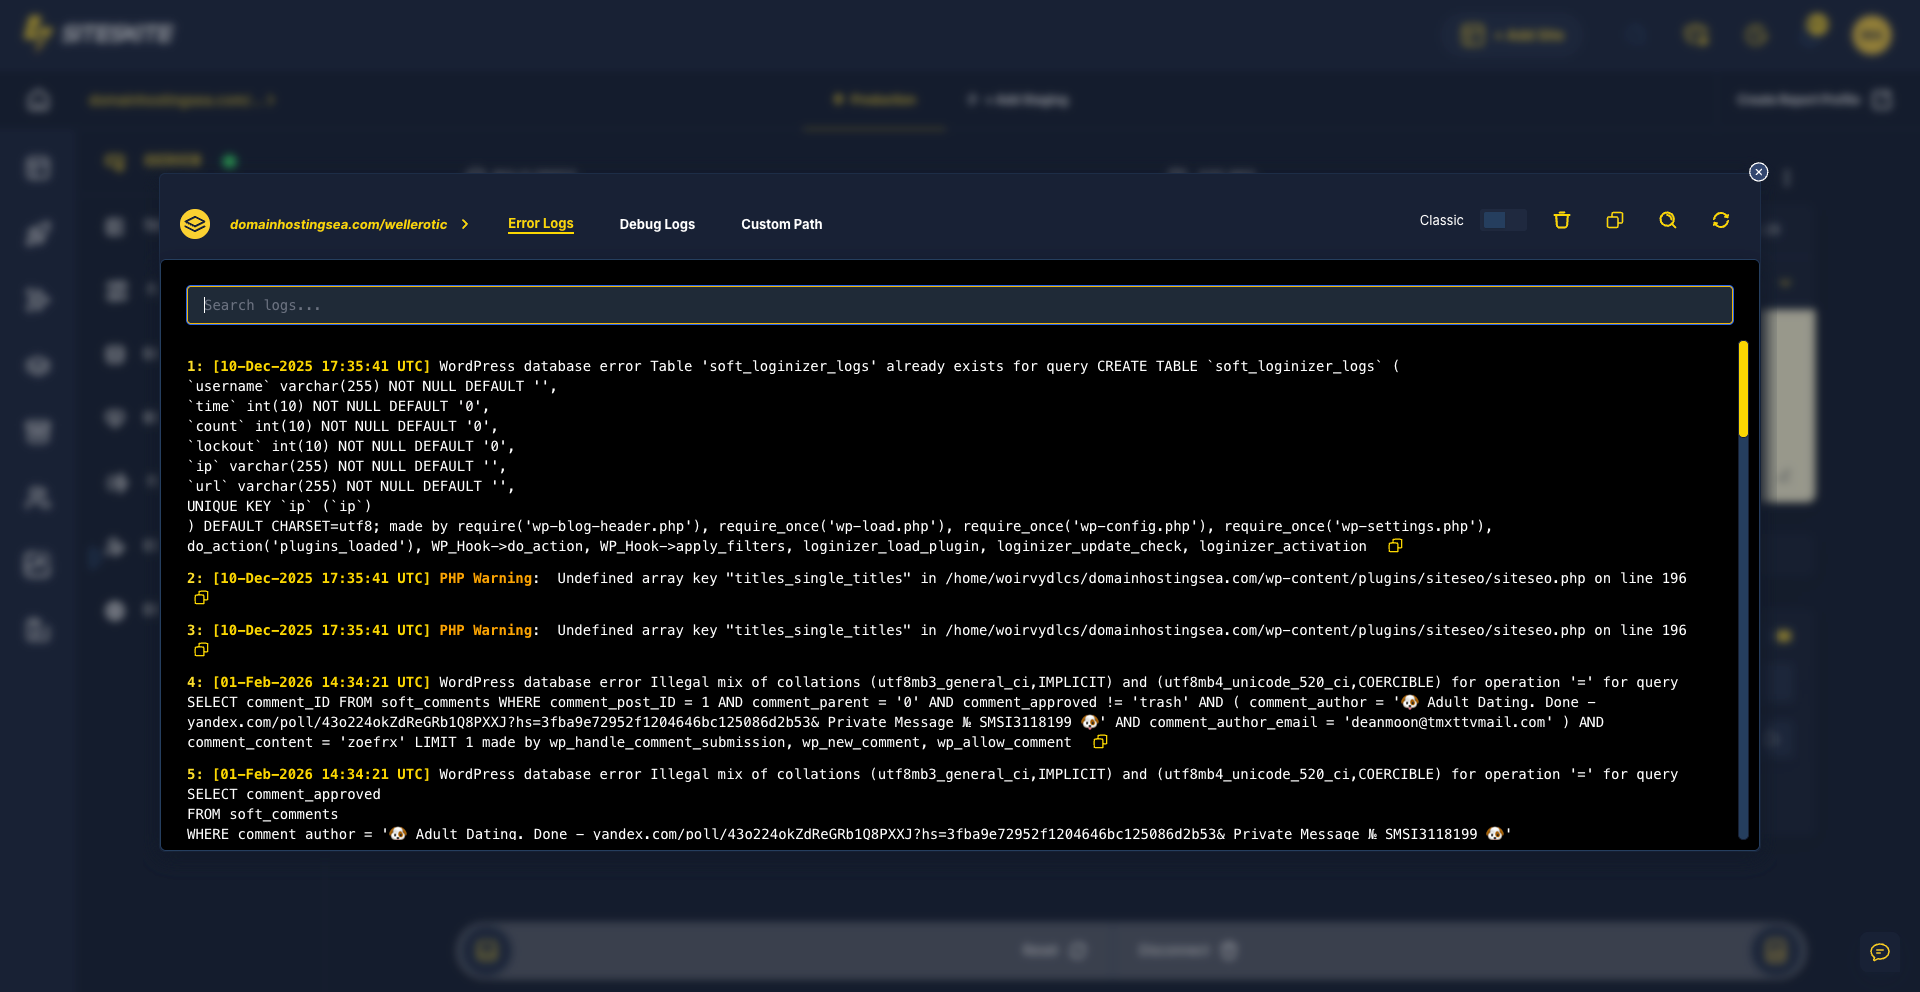
What is Pretty Logs?
Pretty Logs is a visual log monitoring system inside SiteSkite that helps you:
Read PHP errors clearly
Monitor WordPress debug logs
Track fatal errors and warnings
Inspect custom application logs
Troubleshoot issues faster
Monitor site activity without leaving SiteSkite
Available Log Types
SiteSkite currently supports three log views:
PHP Error Log
Displays your server’s PHP error logs.
Useful for:
Fatal PHP errors
Warnings
Deprecated functions
Plugin compatibility issues
Memory exhaustion problems
Debug Log
Reads the WordPress debug.log file.
Useful for:
WordPress debugging
Plugin development
Theme debugging
Tracking custom code issues
Typically generated when:
define('WP_DEBUG', true);
define('WP_DEBUG_LOG', true);
is enabled.
Custom Path Logs
You can manually define a custom log file path.
This is useful for:
Custom application logs
Third-party plugin logs
Security logs
API logs
Web server logs
WooCommerce logs
Custom PHP frameworks
Why Pretty Logs Exists
Traditional log management is messy:
Hosting panels are slow
SSH access may not be available
Raw logs are difficult to read
Teams constantly switch between tools
Pretty Logs brings debugging directly into your WebOps workflow.
Everything stays centralized inside SiteSkite.
Key Features
Better Readability
Logs are formatted for easier scanning and troubleshooting.
Timestamp Visibility
Each entry clearly displays:
Date
Time
Error type
Faster Error Detection
Quickly identify:
Fatal errors
Warnings
Database issues
Plugin conflicts
Centralized Debugging
No need to leave the SiteSkite dashboard.
Multi-Site Visibility
Monitor logs across multiple linked websites from one place.
Common Use Cases
Plugin Conflicts
Identify which plugin triggered a fatal error.
White Screen Debugging
Track PHP syntax or memory issues causing site crashes.
Migration Troubleshooting
Monitor logs during backup restores or migrations.
WooCommerce Issues
Inspect payment, checkout, or webhook failures.
Custom Development
Track API responses or development logs.
How to Access Pretty Logs
Open your linked website inside SiteSkite
-
Navigate to:
Logs / Error Logs section
-
Choose one of:
PHP Error Log
Debug Log
Custom Path
Start reviewing logs in real-time
Custom Path Configuration
When using Custom Path:
Enter the absolute log file path
Save the configuration
SiteSkite will begin reading the log file
Example:
/home/public_html/logs/custom-error.logBenefits of Pretty Logs
Faster Troubleshooting
Identify issues immediately without server access.
Cleaner Workflow
Stay inside SiteSkite while debugging.
Reduced Downtime
Resolve errors before they escalate.
Better Team Collaboration
Teams can inspect logs from one centralized dashboard.
Ideal for Agencies
Monitor multiple client websites efficiently.
Best Practices
Enable WordPress debug logging on staging sites
Clear old logs regularly
Avoid exposing logs publicly
Use staging environments for debugging first
Monitor logs after updates or deployments
Important Notes
SiteSkite only reads logs that are accessible by the server
Custom paths must be valid and readable
Very large log files may load progressively
Some managed hosting providers restrict log access
Summary
Pretty Logs transforms raw server debugging into a clean visual experience inside SiteSkite.
Instead of chasing errors through terminals and hosting dashboards, you can now:
Read → Diagnose → Fix
All from one centralized WebOps dashboard